Second Installment Bills will be due October 1, 2021
The 2020 property tax rates, calculated by the Cook County Clerk for more than 1,400 taxing agencies, were released today.
Cook County Clerk Karen A. Yarbrough said her office has been working with other government stakeholders in recent months to collect data and accurately calculate the 2020 rates included in today's nearly 80‐page property tax rate report. The Clerk's Tax Extension Unit is responsible for calculating property tax rates for all local governments in Cook County that authorize the collection of revenue through real estate taxes.
"The work of calculating and publishing these tax rates is a massive effort and we have worked diligently with our government partners to publish these rates in a timely fashion based upon tax levies submitted by the county’s taxing districts and the valuation of properties within those districts,” said Yarbrough.
Total Tax Billed Continues to Increase Year Over Year
Once again, the total property tax billed for taxing districts in Cook County continues to steadily increase. Last year the total tax billed was $15.6 billion, this year the total tax billed is over $16.1 billion. This is a nearly 3.5% increase which is due to several factors such as assessed values, taxing district levies, and the state‐issued equalization factor.
2020 Re‐Assessment & COVID‐19 Adjustment
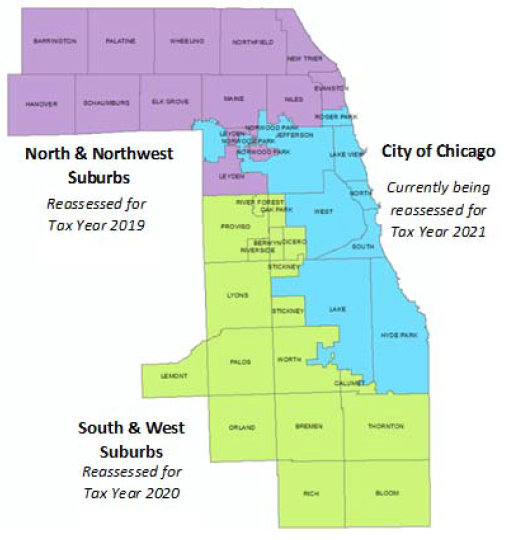
Each year one‐third of the County is fully reassessed by the Cook County Assessor’s office. The south and western suburbs were reassessed for tax year 2020, the north and northwestern suburbs were reassessed for tax year 2019 and the City of Chicago is currently being reassessed for tax year 2021.
In addition to this normal reassessment, a COVID‐19 adjustment was applied to the entire county this year. The COVID‐19 adjustment was established by the Cook County Assessor to reduce the tax burden borne by taxpayers as a result of the pandemic and its economic effect. The extent of the adjustment was dependent upon the usage of the property and locations within Cook County. (For additional information refer to Cook County Assessor’s COVID‐19 Adjustment
Reports: www.cookcountyassessor.com/covid19)
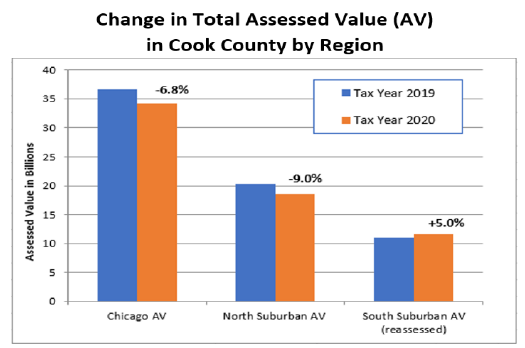
This adjustment resulted in a reduction to the overall assessed value in the north and northwest suburbs and in the City of Chicago. However, the south and western suburbs experienced an overall increase in total assessed value which was tempered by the COVID‐19 adjustment to residential and commercial properties.
Comparative Property Tax Changes
Increases or reductions in assessed values do not necessarily mean increases or reductions in property taxes to individual properties. Changes in property taxes may be analyzed in many ways such as, but not limited to, by median, average, region or municipality.
In order to assess the changes impacting Cook County properties as a whole, the following examples utilize average estimated market values of Single‐Family Dwellings and Commercial properties to evaluate possible property tax changes by region. (See page 3 for factors which may impact individual tax increases or decreases.)
For a more granular examination of changes in median taxes and individual tax bill increases or decreases at local levels by property classification, see the Tax Year 2020 – Property Tax Bill Analysis prepared by the Cook County Treasurer. https://www.cookcountytreasurer.com/pdfs/taxyear2020taxbillanalysis/taxyear2020analysis.pdf
Property Tax Changes for Average Single‐Family Dwellings by Region
AVERAGES ONLY; Individual Property Tax Bills Will Vary Depending on Impacting Factors
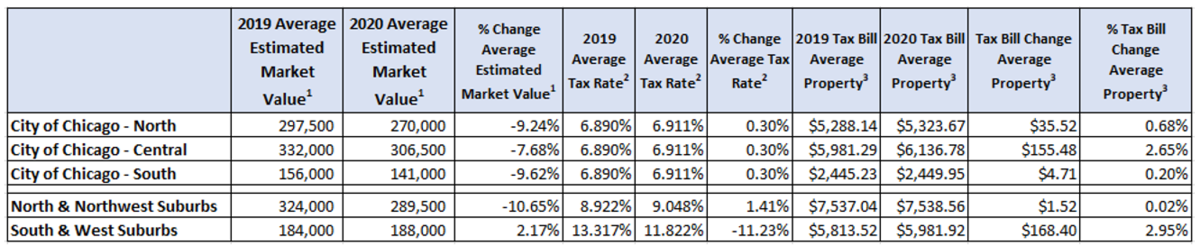
- Average Estimated Market Value based on Average Assessed Value for single family residences divided by level of assessment.
- Chicago Average Tax Rate incl. Cook County, Forest Preserve, City of Chicago (incl. Library & Bldg. Funds) Board of Education, City Colleges, Chicago Park District, & Metropolitan Water. Suburban Average Tax rates =Total Tax in Region divided by Total Equalized Assessed Value (EAV) in Region. Actual rates within Regions will vary.
- Average Tax Bill amounts based on Average Estimated Market Value as listed for each Region.
Property Tax Changes for Commercial Properties by Region
AVERAGES ONLY; Individual Property Tax Bills Will Vary Depending on Impacting Factors
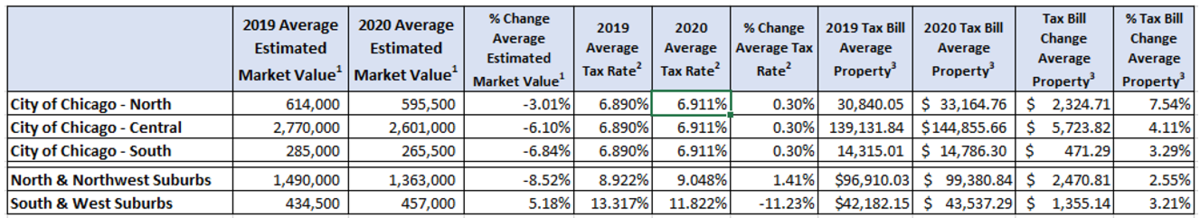
- Average Estimated Market Value based on Average Assessed Value for commercial properties divided by level of assessment.
- Chicago Average Tax Rate incl. Cook County, Forest Preserve, City of Chicago (incl. Library & Bldg. Funds) Board of Education, City Colleges, Chicago Park District, & Metropolitan Water. Suburban Average Tax rates =Total Tax in Region divided by Total Equalized Assessed Value (EAV) in Region. Actual rates within Regions will vary.
- Average Tax Bill amounts based on Average Estimated Market Value as listed for each Region.
The table below examines possible property tax changes for sample residential properties with the same estimated market value last year (tax year 2019) across three different regions. This reflects the impact of the reassessment in the south and western suburbs, the countywide COVID‐19 adjustment, and overall tax rate changes across each respective region.
Property Tax Changes for Sample Residential Property
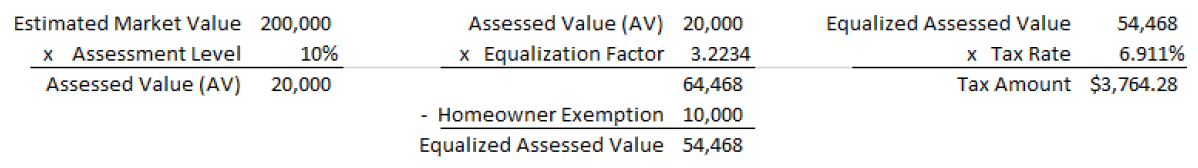
Possible impact of changing Assessments and Rates on sample residential properties which had an assessed value of $250,000 in tax year 2019 in the three regions of Cook County.
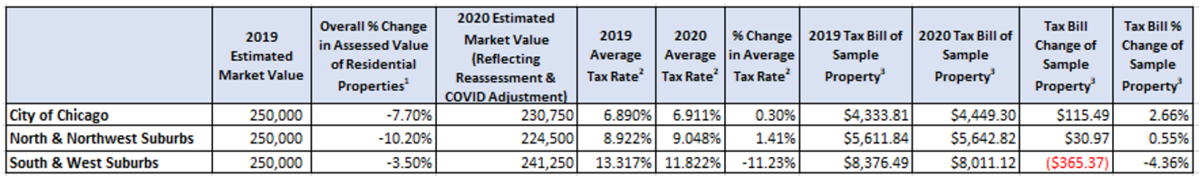
- Percent change in total Assessed Value of residential properties by region; South & West suburbs were reassessed for tax year 2020; a COVID‐19 assessment adjustment was applied countywide. Actual assessment increases or decreases will vary.
- Chicago Average Tax Rate incl. Cook County, Forest Preserve, City of Chicago (incl. Library & Bldg. Funds) Board of Education, City Colleges, Chicago Park District, & Metropolitan Water. Suburban Average Tax rates =Total Tax in Region divided by Total Equalized Assessed Value (EAV) in Region. Actual rates within Regions will vary.
- Sample Residential Tax Bill calculated as: Assessor‐derived Market Value x 10% Assessment Level x Equalization Factor) minus Homeowner Exemption) x Tax Rate
The following table below examines possible property tax changes for sample commercial properties with the same estimated market value from tax year 2019 across three different regions. It illustrates the impact of the reassessment in the south and western suburbs, the countywide COVID‐19 adjustment, and overall tax rate changes across each respective region.
Property Tax Changes for Sample Commercial Property
Possible impact of changing Assessments and Rates on sample commercial properties which had an assessed value of $500,000 in tax year 2019 in the three regions of Cook County.
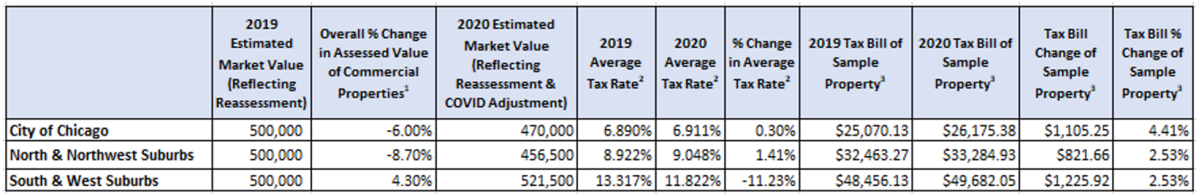
- Percent change in total Assessed Value of residential properties by region; South & West suburbs were reassessed for tax year 2020; a COVID‐19 assessment adjustment was applied countywide. Actual assessment increases or decreases will vary.
- Chicago Average Tax Rate incl. Cook County, Forest Preserve, City of Chicago (incl. Library & Bldg. Funds) Board of Education, City Colleges, Chicago Park District, & Metropolitan Water. Suburban Average Tax rates =Total Tax in Region divided by Total Equalized Assessed Value (EAV) in Region. Actual rates within Regions will vary.
- Sample Commercial Tax Bill calculated as: (Assessor‐derived Market Value x 25% Assessment Level x Equalization Factor) x Tax Rate
Factors that Impact Property Tax Increases or Decreases
The tables above provide examples of average trends within Cook County. The average residential tax bill is likely to increase by less than 3% for tax year 2020 for some properties, while others may experience a larger increase. However, if individual assessed values and tax rates have both decreased, some properties may experience a property tax decrease.
With over 1,400 taxing districts servicing over 1.8 million properties of numerous classifications and values, there is a great deal of variability in individual tax bills and the respective changes taxpayers may experience compared to last year. This variability is based on a number of factors.
The four most impactful factors which affect whether or not individual property tax bills will increase or decrease are:
- The amount of property tax requested by the taxing districts (property tax levies)
- The change in the value of a property relative to other properties within the same districts (property assessment)
- The 10.5% increase in the state‐issued equalization factor compared to the prior year (from 2.9160 for 2019 to 3.2234 for 2020)
- Property tax exemptions. (For example, if a property received a Homeowner Exemption one year, but did not receive it the following year, the final taxable value of that property could be up to 10,000 higher without the exemption.)
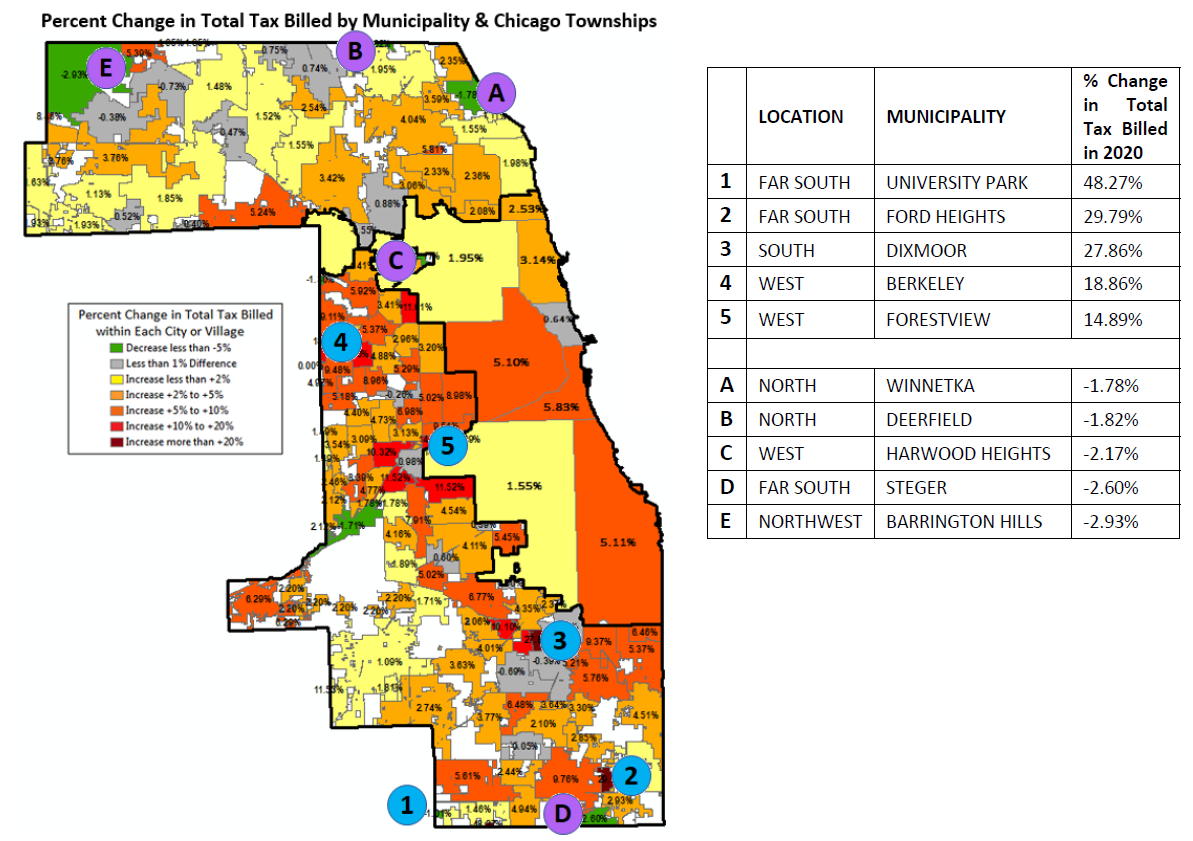
Municipalities with Largest Increases and Decreases in Total Tax Billed
Below is a map of Cook County displaying the percentage increases or decreases in total property tax billed within each City or Village for tax year 2020. The five municipalities with the largest increases and decreases in total tax are listed in the corresponding table which indicates the variation that can occur in tax bills across the County and the City of Chicago.
It is important to note that individual properties within each city, village, or township may experience property tax increases or decreases which do not align with the overall tax increase or decrease for that area. For example, not every property in the Village of Ford Heights will experience a property tax bill increase of 30%. In fact, 10% of the properties in Ford Heights have lower tax bills this year compared to last year.
Equalized Assessed Values
Property assessments in Cook County are set by the Cook County Assessor and finalized by the Cook County Board of Review. These assessments are equalized using the Illinois Department of Revenue’s (IDOR) state equalization factor. (To ensure uniform assessment statewide, each year the Illinois Department of Revenue (IDOR) calculates the factor needed to bring the total assessed
value of all properties in Cook County to a level equal to 33 1/3 percent of the total market value of all Cook County real estate.)
As reported earlier, overall assessed values in the south and western suburbs, which were reassessed this year, increased. Assessed values in the north and northwest suburbs and in the City of Chicago decreased this year, due in part to the COVID‐19 assessment adjustment. The countywide assessed value of all properties decreased by nearly 5% in 2020 compared to 2019.
The overall reduction in assessed value in Cook County this year was offset by a 10.5% increase in the equalization factor set by the Illinois Department of Revenue which increased from 2.9160 in 2019 to 3.2234 in 2020. The 2020 equalization factor is the third highest on record and the highest factor since tax year 2010. This in turn impacted the overall taxable value (equalized assessed value or EAV) in Cook County, which increased by 4.16% this year.
The chart below reflects changes in equalized assessed values across Cook County. The largest changes this year are in the south and western suburbs which were impacted by the triennial reassessment for tax year 2020.
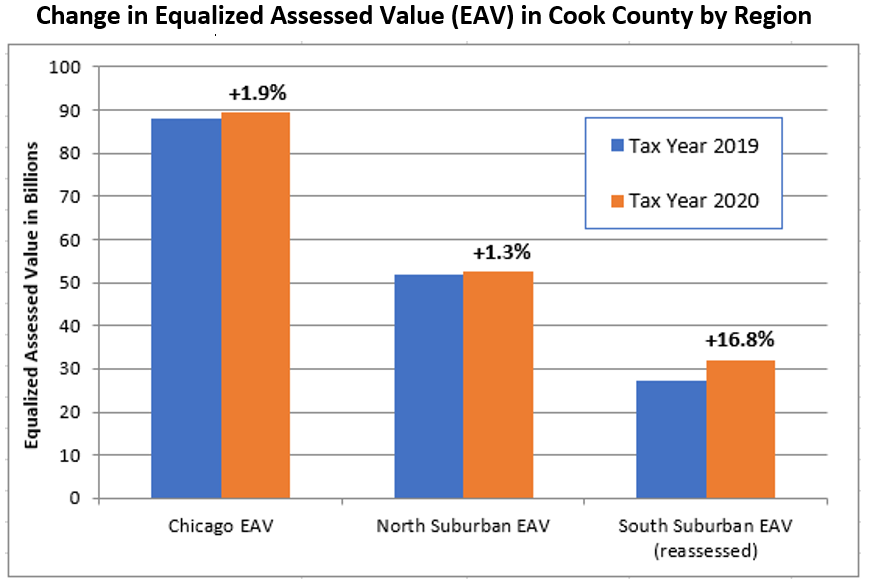
In the City of Chicago and the north and northwestern suburbs, where assessed values were reduced by the COVID‐19 adjustment, the increased equalization factor resulted in moderate EAV growth.
However, EAVs in the south and western suburbs are up 16.8% overall. This increase is a combination of the larger state‐issued equalization factor and increases in assessed values from the reassessment.
Calculation of Tax Rates
Determining property tax rates requires input from multiple county offices and all of the taxing districts in Cook County. A taxing district is a government body such as a school district, library or municipality which is authorized to receive funding from property taxes. Each district in Cook County submits a property tax levy to the County Clerk each year.
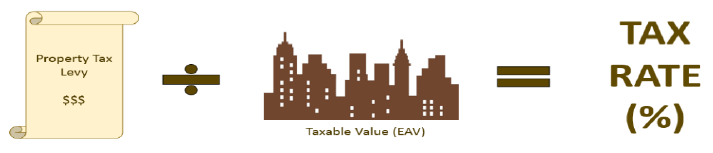
The County Clerk is responsible for calculating tax rates by dividing taxing district levies by the total taxable value (EAV) of all property within each district as determined by the Cook County Assessor and Board of Review. The tax rates of all districts that service a particular property are combined to create the composite tax rate for that property.
In simple terms, a tax rate is a taxing district’s property tax levy divided by taxable value within that district.
Statutory Limits on Tax Increases
The Illinois Property Tax Extension Limitation Law (PTELL), also known as the “Tax Cap Law,” was put in place in the mid‐1990s to prevent districts from increasing their property tax revenues by more than the rate of inflation. This year, districts were limited to an increase of 2.3% (the 2020 Consumer Price Index). However, the Tax Cap Law does not apply to home rule districts, debt obligations, special purpose funds and value derived from new property or terminated Tax Increment Financing Districts (TIFs). Additionally, with voter approval, individual taxing districts may increase their property tax collects beyond what is otherwise allowed by the Tax Cap Law.
Changes in Total Taxes by Region
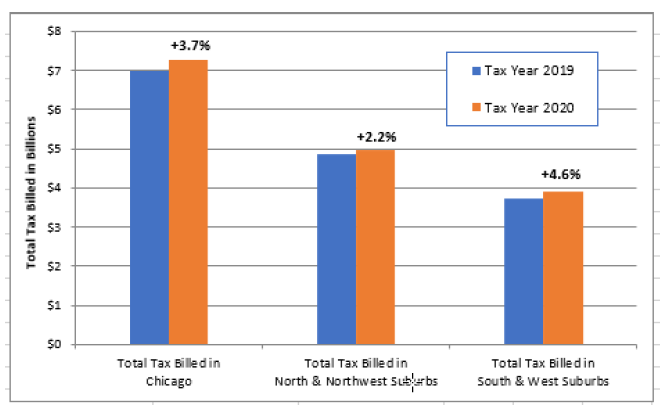
The total taxes billed in Cook County increased nearly 3.5% for tax year 2020 compared to 2019. The chart below reflects a breakdown of tax increases by region.
Changes in Total 2020 Taxes Billed in Cook County by Region
Calculation of Tax Bills
Individual Residential Tax Bill Calculation
Overview of South and West Suburban Cook County
The south and west suburbs (south of North Avenue) were reassessed for tax year 2020. This region of the county has historically had lower property values. The smaller value base in this region results in higher tax rates than both the City of Chicago and the northern suburbs. (See the following pages for more information about these areas.)
The combination of lower property values and higher tax rates do not necessarily result in higher or lower tax bills. (See FAQs for additional information.)
The total equalized assessed value (EAV) in the south and western suburbs grew nearly 17% this year due to a combination of the 2020 reassessment and a higher state‐issued equalization factor. The increase in EAV means that the overall property tax burden in Cook County has shifted towards the south and western suburbs and away from the City of Chicago and the north and northwestern suburbs.
This does not necessarily mean that taxes will increase for individual taxpayers in this region. Typically, when EAVs increase, tax rates decrease, and vice versa. While EAVs have increased in this region, the overall tax rate (total tax divided by total EAV) has decreased by 11.2%. For individual property owners whose assessed values decreased or increased modestly, this could mean a reduction in property taxes this year.
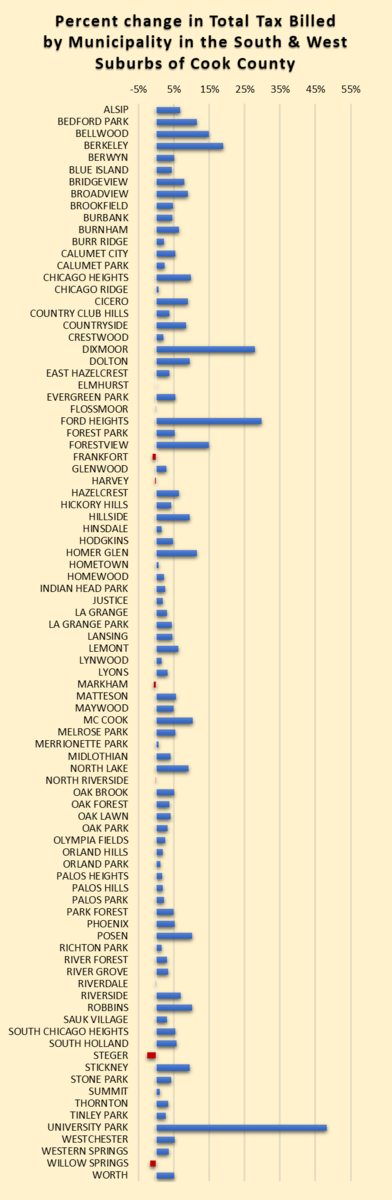
The chart below reflects the percent change in total taxes billed in the south and west suburbs (Melrose Park, Northlake, and River Grove cross North Avenue, which is the boundary between the north/northwest assessment area and the south/west assessment area. The portions of these municipalities lying south of North Avenue were reassessed for tax year 2020.) which were reassessed for tax year 2020. Some districts experienced significant increases while others had more modest increases or even decreases in the total tax billed.
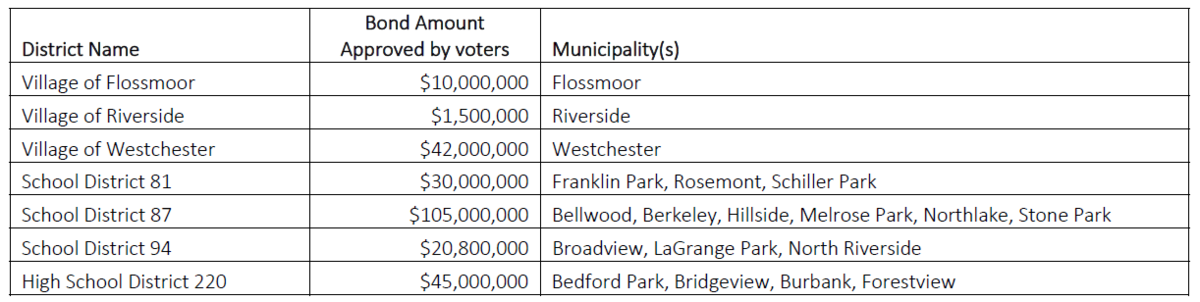
Where the overall tax rate in the south and west suburbs has decreased by 11.2%, there is a great deal of variability among the many taxing districts located in this region. For example, the tax rate for School District 87 decreased by 0.54% due to a 25.6% increase in the district’s total levy. The levy increase is the result of a voter‐approved a referendum in March 2020 which allowed the district to take out $105 million in debt service bonds. These bonds will be paid by taxpayers in Bellwood, Berkeley, Hillside, Melrose Park, Northlake and Stone Park over the course of the next 20 years.
This chart reflects taxing districts in which debt service increases were authorized by the voters.
Additionally, voters in the Yorkfield Fire Protection District (unincorporated Proviso Township) approved a “Limiting Rate Increase” referendum in March 2020. This successful referendum allows the district to receive more property tax revenue than would otherwise have been authorized by the Tax Cap Law.
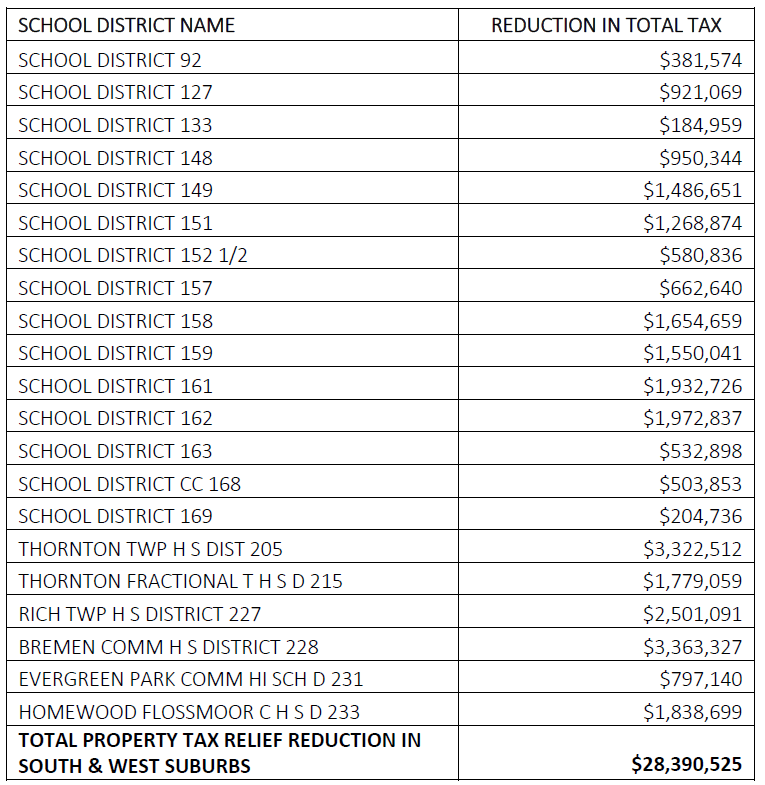
Through the Property Tax Relief program authorized by the State of Illinois, 21 school districts in the south and western suburbs were eligible to provide property tax relief to their constituents this year through a combination of grants and levy reductions.'
Overview of the City of Chicago
While the City of Chicago was not reassessed for tax year 2020, the Cook County Assessor applied a countywide COVID‐19 adjustment for tax year 2020.
The total tax billed by the major taxing districts in the City of Chicago increased 2.25%, which is only slightly higher than the 1.93% increase in the total taxable value in the City of Chicago in 2020 compared to 2019. This results in the general composite tax rate in the City of Chicago remaining nearly flat in 2020 compared to 2019, increasing only 0.3% from 6.890% to 6.911% in 2020.
Individual properties in the City of Chicago with assessed value increases of less than 10.5% will typically experience reduced taxable values and lower tax bills, while those with increases of more than 10.5% will typically experience increased taxable values and higher tax bills.
Overview of North and Northwestern Suburban Cook County
Like the City of Chicago, the north and northwestern suburbs were not reassessed for tax year 2020, however the Cook County Assessor applied a countywide COVID‐19 adjustment for tax year 2020. The increase in the equalization factor offset the COVID‐19 adjustment and contributed to a 1.3% increase in the overall taxable value (EAV) of this region. The total tax amount billed in this area increased 2.2%, and the overall tax rate for this region increased approximately 1.4%.
As occurs in the south and western suburbs, tax rates differ in the various southern suburbs due to the large number of municipalities, school districts, park districts and other taxing districts which provide different services. Specific areas will experience larger or smaller tax changes depending on the taxing districts associated with those areas. Additionally, taxpayers within the same suburb may pay different rates based on the specific taxing districts which provide their services.
Taxing districts may increase their levies more than would otherwise be allowed by the Tax Cap law by submitting the question to voters through a direct referendum. Below is a chart of taxing districts in which debt service bond increases were authorized by the voters in the north and northwest suburbs.
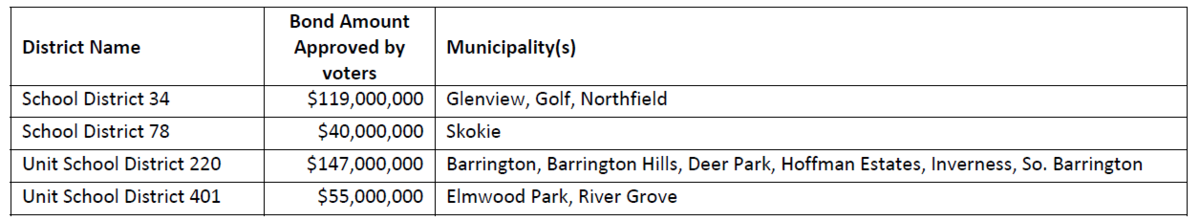
Voters in Morton Grove Park District and the Gail Borden Library District (Bartlett, Elgin, Hoffman Estates, and Streamwood) also approved “Limiting Rate Increase” referenda in March 2020.
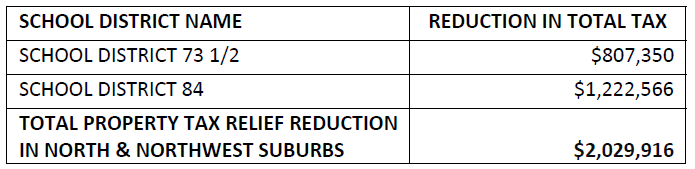
Two school districts in the northern suburbs were eligible to provide property tax relief to their constituents through the Property Tax Relief Grant program this year.
Summation
- This report has presented the general trends occurring in Cook County. Each tax bill will vary depending on specific circumstances including taxing district levies, individual assessments and other factors.
- The total tax amount billed in Cook County has increased by nearly 3.5%, exceeding $16.1 billion for tax year 2020.
- The overall taxable value (EAV) in Cook County has increased by 4.2% for tax year 2020 compared to 2019.
- A countywide COVID‐19 assessment adjustment reduced assessed values (AVs) in Chicago and in the north/northwest suburbs. Overall AVs in the south/western suburbs have increased despite this adjustment due to the triennial reassessment.
- The state‐issued Equalization Factor increased by 10.5% from 2.9160 in 2019 to 3.2234 in 2020. This factor is the third highest on record and the highest since tax year 2010. An increased Equalization factor offsets AV reductions and amplifies AV increases.
- Tax rates are generally lower in the south/western suburbs and are mostly flat or up slightly in Chicago and the north/northwestern suburbs.
- Increased EAVs coupled with lower rates will likely result in a 3% increase in average south/western suburban residential property tax bills. Individual tax bill changes will vary.
- The 2020 second installment property tax bills are currently payable online. Tax bills will be mailed later this month and will be due by October 1, 2021.
###