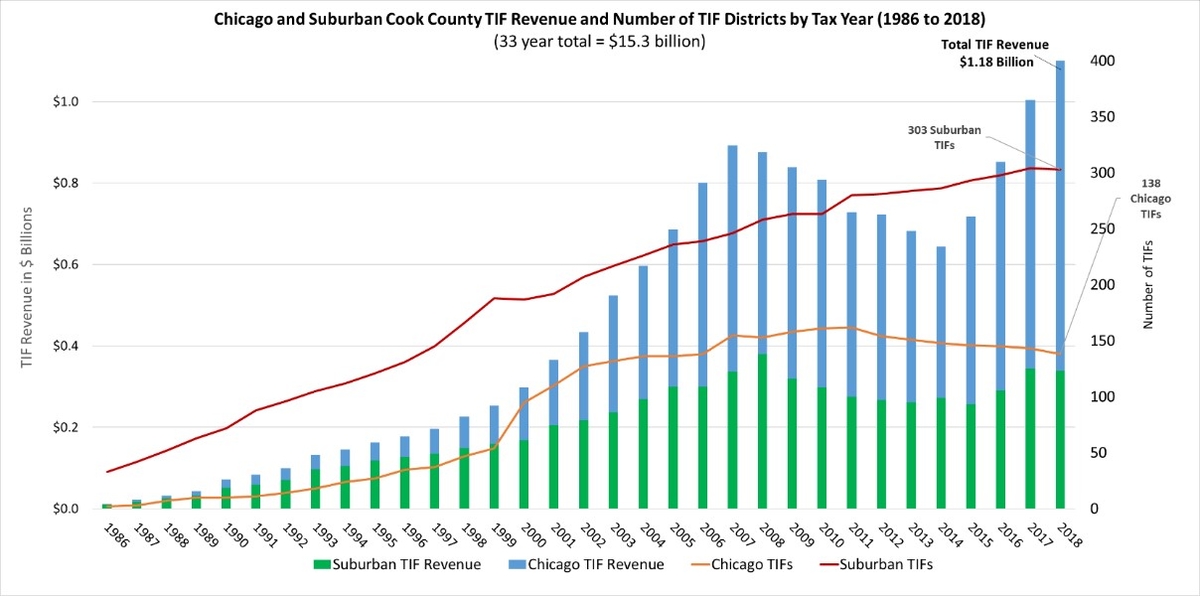
Tax Increment Financing (TIF) districts in Cook County will bring in nearly $1.2 billion for tax year 2018, according to a report Wednesday from Cook County Clerk Karen A. Yarbrough’s office. This is a 17.4% increase over last year. TIF revenue has increased 27.4% in the City of Chicago and decreased 1.6% in the suburbs compared to last year.
The Clerk’s full 2018 TIF Revenue Report shows Chicago TIFs will generate approximately $841 million in tax revenue from its 138 TIFs in the 2018 tax year. This is a $181 million increase over last year and includes nearly $116 million for the City’s “Transit TIF” located on the north side of the City[1]. Last year, Chicago TIF revenue saw an increase of $99 million. The 303 suburban TIFs are expected to bring in $339 million, a $5 million decrease from last year.
“As a taxpayer and property owner, as well as an elected official who has to answer to the people of Cook County, I want to know where my tax dollars are going, if I live in a TIF District, and how this affects the distribution of tax revenue,” Clerk Yarbrough said. “I am committed to ensuring that all Cook County’s taxpayers, be they Chicago or suburban property owners, have the information and tools available to see where TIFs are and how much revenue they generate.”
The graph below shows TIF Revenue and the number of TIFs in Chicago and the Suburbs for the past 33 years that TIF has been utilized in Cook County.
TIFs account for 8% of property taxes billed in Cook County
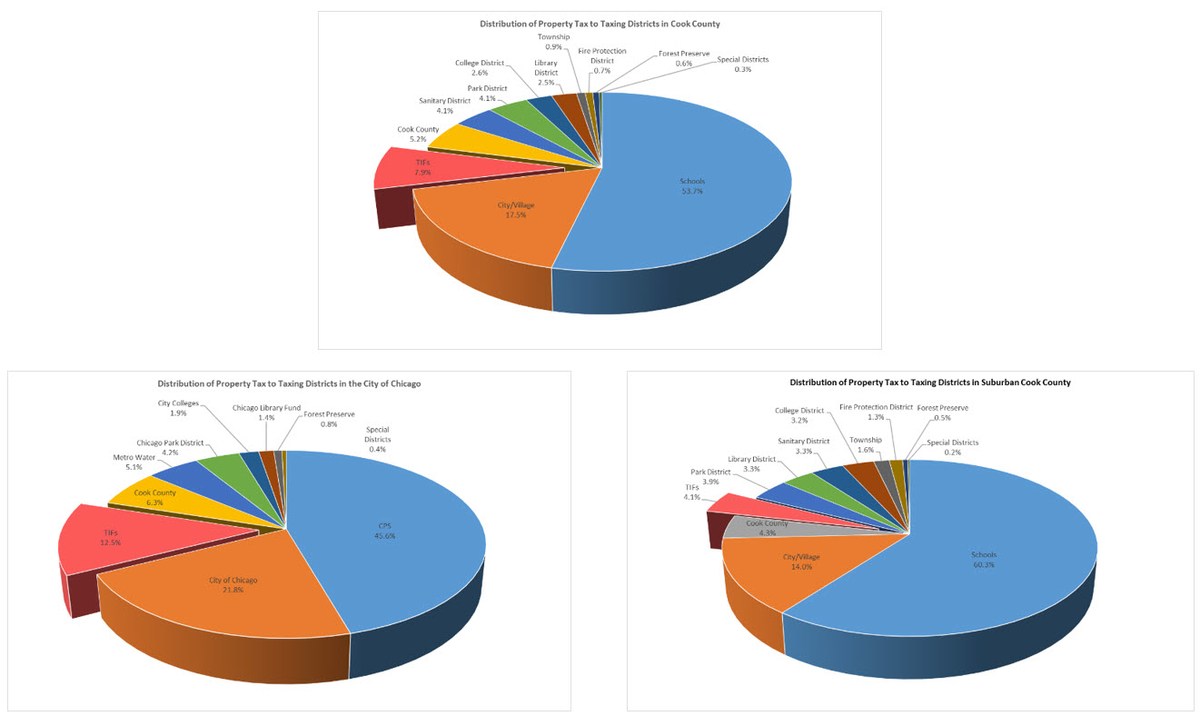
The $1.2 billion derived from TIFs in Cook County amounts to 8% of the total property tax ($14.9 billion) billed to Cook County taxpayers this year. Last year, $1 billion in TIF revenue accounted for 7% of the $14.4 billion property tax total. TIFs account for 13% of the total tax billed for all taxing districts in the City of Chicago and 4% of the total tax billed for all taxing districts in the suburbs this year. These distributions are displayed on the pie charts below.
The Clerk’s role in TIF tabulation
The process of calculating property taxes begins every year with municipalities and other taxing districts approving their annual property tax levies and submitting them to the County Clerk. The Clerk’s office calculates a tax rate for each district by dividing the levy (the amount of property tax revenue requested by the taxing district) by the total taxable value or equalized assessed value (EAV) of that district. That rate is applied to all properties within that district to generate the respective tax bills.
However, TIFs work differently and the requested TIF revenue is not required to be included in a municipality’s annual property tax levy. Pursuant to statute, TIFs follow their own approval process. Once a TIF is approved and an ordinance is passed, the municipality submits that documentation to the County Clerk’s office. The Clerk determines the initial EAV within the TIF as of the date the TIF was adopted. This initial EAV is then “frozen” for the life of the TIF (typically 23 years). Each subsequent year, the growth in property values reflected in EAV is measured. This value growth, known as the Incremental EAV, is then multiplied by the composite tax rate of the properties inside the TIF to calculate the TIF incremental revenue. The property taxes generated by this increase in property values within the TIF boundaries is distributed to the TIF. Property tax generated by the value of the Frozen EAV in the TIF goes to the other taxing districts. See the chart below for an illustration of this process.

Pursuant to statute and ordinance, TIF revenue is not requested through a tax levy and therefore is not included in a municipality’s yearly tax levy process. Thus, once a TIF ordinance is submitted to the Clerk’s Office for the initial creation of the TIF district, the TIF district will continue to receive TIF revenue for the duration of the TIF without requiring a yearly levy or further documentaion. A TIF district’s revenue will continue by operation of law to be calculated in the manner shown above, unless the Clerk’s Office is provided with writtten direction from a municipality to terminate the TIF or alter the boundary of a TIF.
Breakdown of taxes billed by TIF revenue and Tax Levy revenue
As illustrated by the pie charts below, Chicago TIF revenue, when added to the property tax generated by the City’s 2018 property tax levy, is 35% of the total tax that may be distributed to the City of Chicago. The combined total of all suburban TIF revenue accounts for 20% of the property tax revenue to be collected by suburban municipalities[2].

Factors that impact TIF revenue
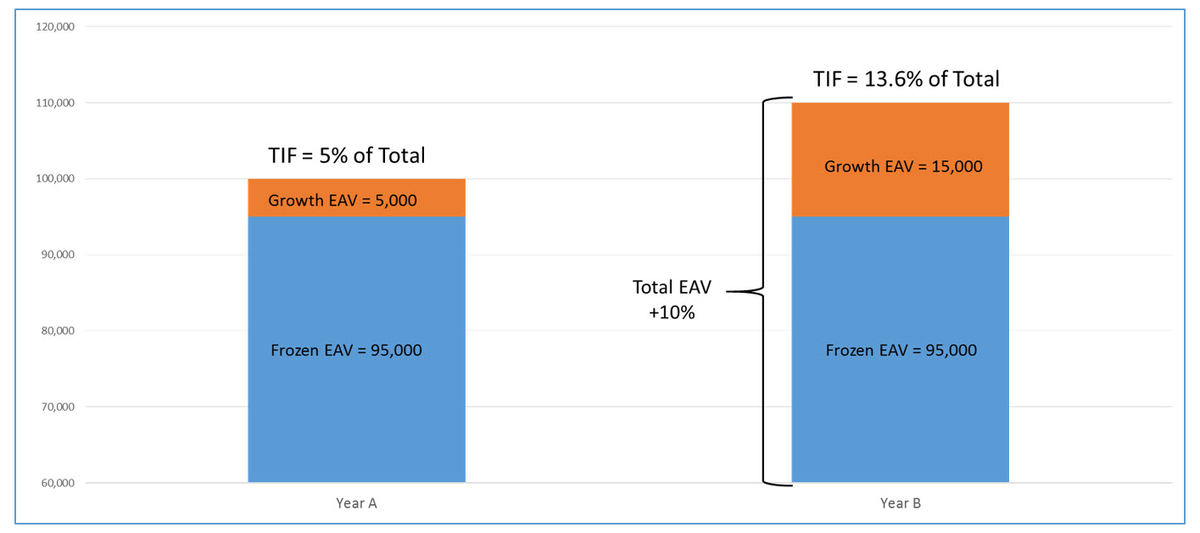
As shown above, TIF revenue is a combination of the composite tax rate of the taxing districts within the TIF and the increase in EAV that has occurred since the TIF’s inception at the Frozen EAV. Of these two factors, increases in EAV have the larger impact upon TIF revenue. This is due to the nature of the TIF and the benchmark of the Frozen EAV. If EAVs within a TIF go up, the entirety of the revenue generated by that EAV growth is allocated to the TIF rather than to other taxing districts.
The example below shows how a 10% increase in the total EAV of a taxing district from Year A to Year B could have a larger impact on TIF. In the example, the 10% increase of total EAV resulted in a 13.6% increase in the TIF’s revenue share, as opposed to 5% the year before.
City of Chicago TIFs
The City of Chicago was reassessed for tax year 2018, resulting in a 12.5% increase in total EAV. This EAV increase contributed to the 27.4% increase in the City’s TIF revenues.
The highest performing TIFs in the City of Chicago this year are located primarily in or around the downtown area. However, the Pilsen TIF on the south side of the City increased 26% and has the 10th highest revenue this year. TIF revenue also increased for the Red Purple Modernization Phase 1 (RPM1) Transit TIF in the north side neighborhood of Lakeview, making it the largest TIF both geographically and financially this year. For more specific information on transit TIFs, see Transit TIF Fact Sheet, Chicago TIF Overview & Chicago TIF Summary
The following chart shows the 10 highest revenue TIFs in the City of Chicago this year. Each TIF will bring in more than $20 million this year.
|
TIF |
First Year |
2018 Revenue |
Total Revenue |
|
Chicago - Transit RPM1 |
2016 |
$115,735,214.75 |
$174,105,069.79 |
|
Chicago - LaSalle Central |
2006 |
$100,926,569.59 |
$361,771,088.82 |
|
Chicago - Kinzie Conservation (Industrial Area) |
1998 |
$49,229,212.64 |
$367,926,939.81 |
|
Chicago - Near North |
1997 |
$35,716,959.86 |
$330,800,054.76 |
|
Chicago - River South |
1998 |
$34,448,113.13 |
$273,240,094.76 |
|
Chicago - Chicago / Kingsbury |
2000 |
$33,177,660.74 |
$270,644,567.14 |
|
Chicago - Canal / Congress |
1998 |
$31,399,421.84 |
$335,286,098.90 |
|
Chicago - Central West |
2000 |
$30,425,107.45 |
$248,283,003.88 |
|
Chicago - River West |
2001 |
$25,761,204.13 |
$211,968,592.60 |
|
Chicago - Pilsen |
1998 |
$20,643,537.57 |
$184,639,325.34 |
The map below shows the location of these TIFs, which account for 57% of the City’s TIF revenue this year.
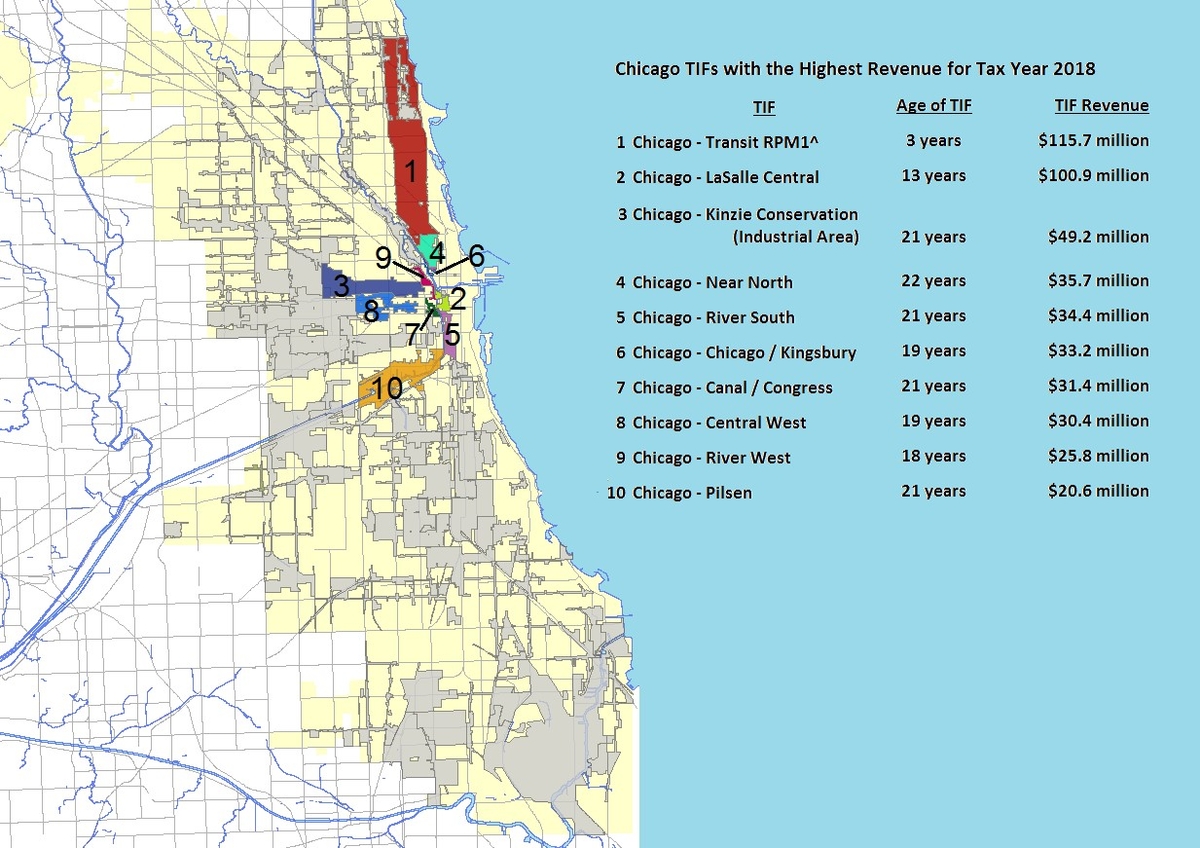
The RPM1 Transit TIF is a mile wide and extends from North Avenue to Devon Avenue along CTA’s Red and Purple line tracks. Now in its third year, the Transit TIF has nearly tripled its revenue compared to last year with close to $116 million in property tax generated. Due to the unique distribution rules established by statute for Transit TIFs (65 ILCS 5/11-74.4-8), the TIF itself will net approximately $45 million of this total. The balance of the revenue brought in by this TIF this year will be distributed to CPS and the other taxing districts such as the County, the Forest Preserve, Metropolitan Water Reclamation, Chicago Parks, City Colleges, and the City of Chicago. This Transit TIF revenue is in addition to the annual tax levies submitted by these taxing districts. See Transit TIF Fact Sheet.
Suburban TIFs
There are currently 303 active TIFs in 99 suburban municipalities. This averages to three TIFs per municipality if a municipality is using TIF. Overall, TIF Revenue in the suburbs decreased 1.62% this year. This is primarily attributable to slight EAV decreases in the suburbs this year. See the Clerk’s 2018 Tax Rate Report for more information.
The table below lists the seven suburban TIFs that generated over $10 million each this year. Of these, five are in the northern or northwestern suburbs and two are in the near western suburbs.
|
TIF |
First Year |
2018 Revenue |
Total Revenue |
|
Glenview - Naval Air Station |
1999 |
$36,677,410.89 |
$453,178,785.73 |
|
Hoffman Estates - Sears |
1989 |
$23,205,954.92 |
$609,432,152.19 |
|
Rosemont - River Road |
1984 |
$17,079,928.10 |
$341,087,750.15 |
|
Town of Cicero |
1987 |
$12,908,052.48 |
$231,092,515.05 |
|
Schaumburg - North Schaumburg |
2014 |
$12,453,521.65 |
$27,817,794.21 |
|
Rosemont - South River Road (4) |
1998 |
$12,351,020.44 |
$66,154,876.87 |
|
Oak Park - Greater Mall Area |
1983 |
$11,756,171.44 |
$193,354,621.55 |
The map below shows the locations of these TIFs.
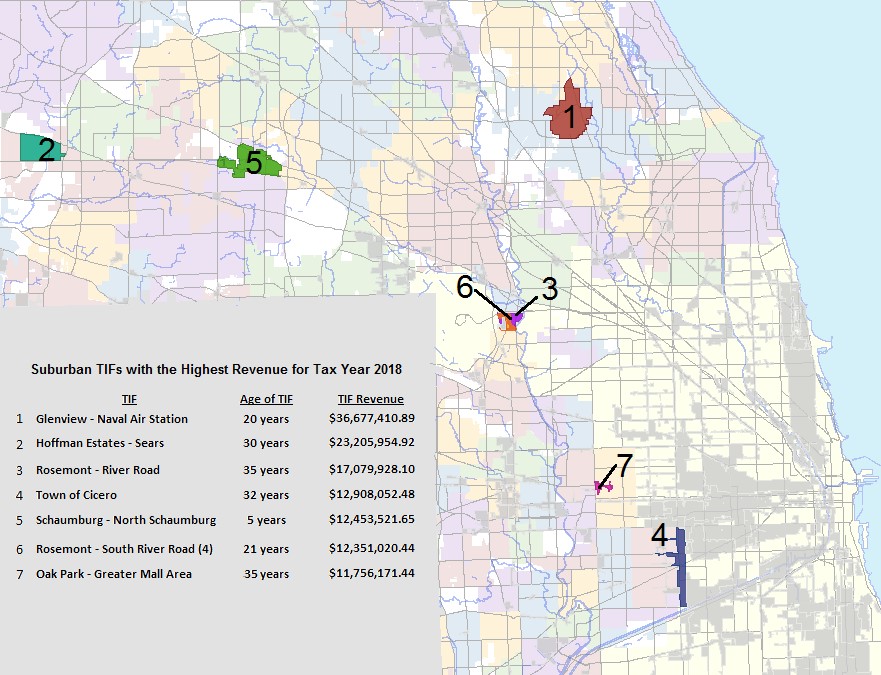
The northern and northwestern suburbs are currently being reassessed for tax year 2019. Increases or decreases in taxable values (EAVs) will likely have an impact on the TIFs in those areas.
See the 2018 Suburban TIF Overview and 2018 Suburban TIF Summary.
Additional TIF Information
To view data on each TIF district, see these PDF sections of the TIF Report: Countywide summary, Chicago summary, Suburban summary, Tax Increment Agency Report, Chicago Overview, Suburban Overview, Transit TIF Fact Sheet, & TIF FAQs.
Visit TIF Viewer, a mapping application, to see TIF data at the map level and search by municipality, ward, address or PIN.
For a brief overview and refresher regarding 2018 TIFs, view our 2018 TIF Quick Fact Sheet.
Previous TIF reports, the TIF property search tool, and TIF maps can be found at cookcountyclerk.com/tifs.
[1] Under the unique formula used for Transit TIFs, approximately $71 million of the Transit TIF’s $116 million revenue this year will be distributed to CPS and other taxing districts impacted by this TIF.
[2] Suburban TIF total as compared to total property tax extension for all suburban cities, towns, and villages, with or without TIF.
