Second-Installment Bills will be due December 1, 2023
The Clerk’s Office has completed the calculation of 2022 property tax rates for more than 1,400 taxing agencies in Cook County and released its annual tax rate report Monday.
The Clerk’s Tax Extension Unit is responsible for calculating property tax rates for all local governments in Cook County that authorize the collection of revenue through real estate taxes, according to Clerk Karen A. Yarbrough.
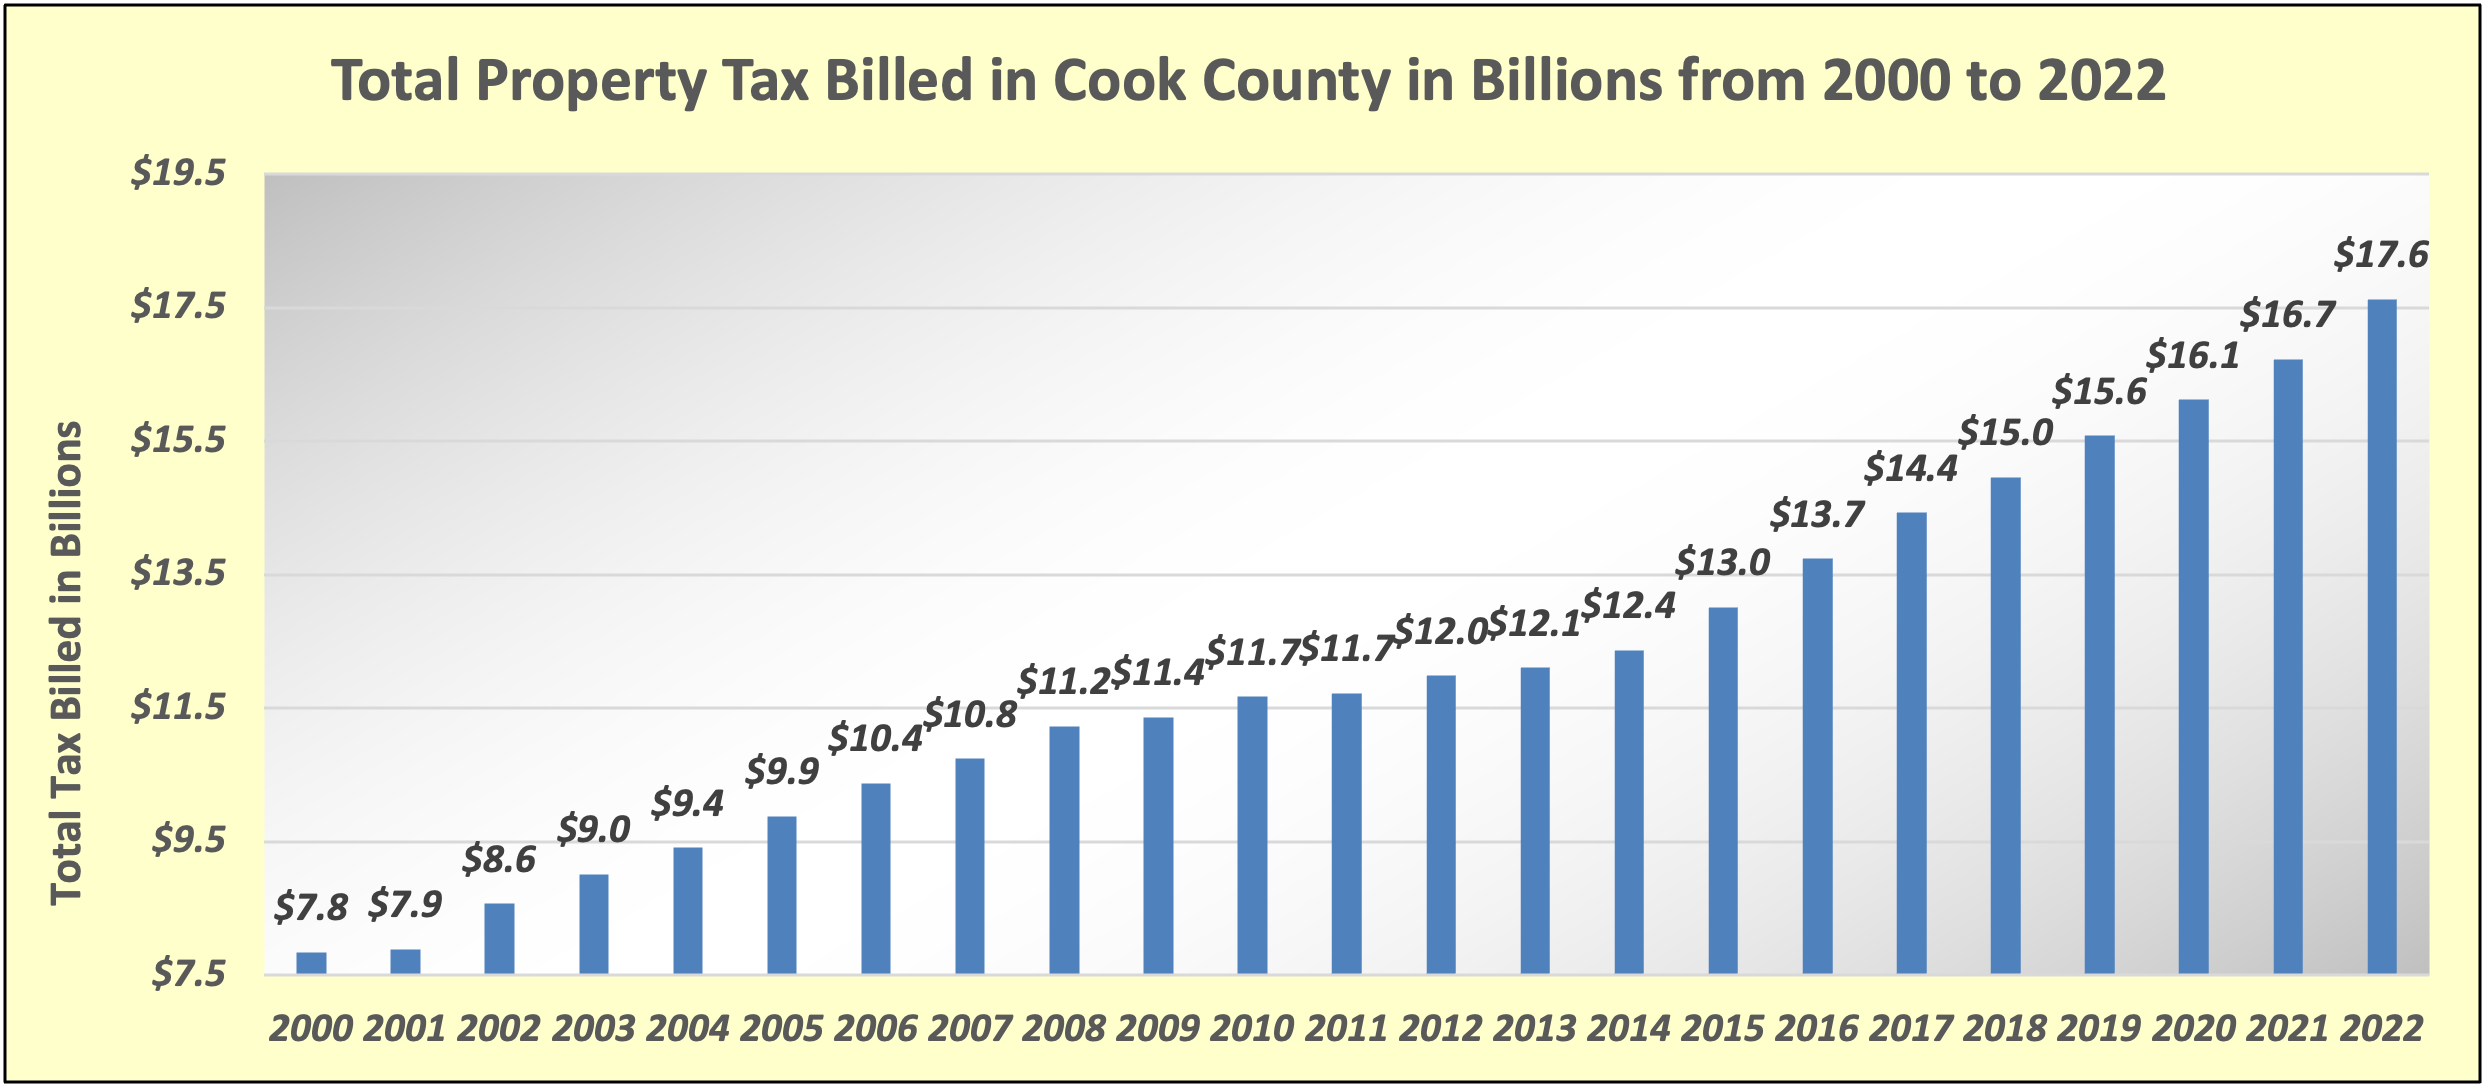
Total Tax Billed Continues to Increase Year Over Year
Once again, the total property tax billed for taxing districts in Cook County continues to steadily increase. Last year the total tax billed was $16.7 billion, this year the total tax billed is over $17.6 billion. This 5.36% increase is due to several factors such as assessed values, taxing district levies, and the state-issued equalization factor.
2022 Re-Assessment
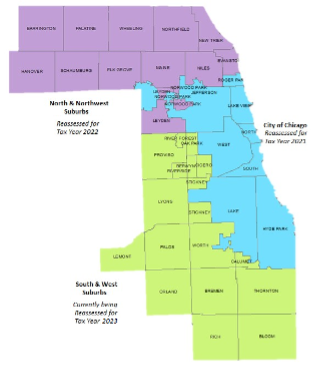
Each year one-third of the County is fully reassessed by the Cook County Assessor’s office.
The North and Northwestern suburbs (suburbs north of North Avenue) were reassessed for tax year 2022, which is reflected in the tax bills currently payable.
The last time this region was examined by assessment officials en masse was tax year 2019.
The south and western suburbs (suburbs south of North Avenue) are currently being reassessed for tax year 2023.
The City of Chicago was reassessed last year (tax year 2021) and will be reassessed again for tax year 2024.
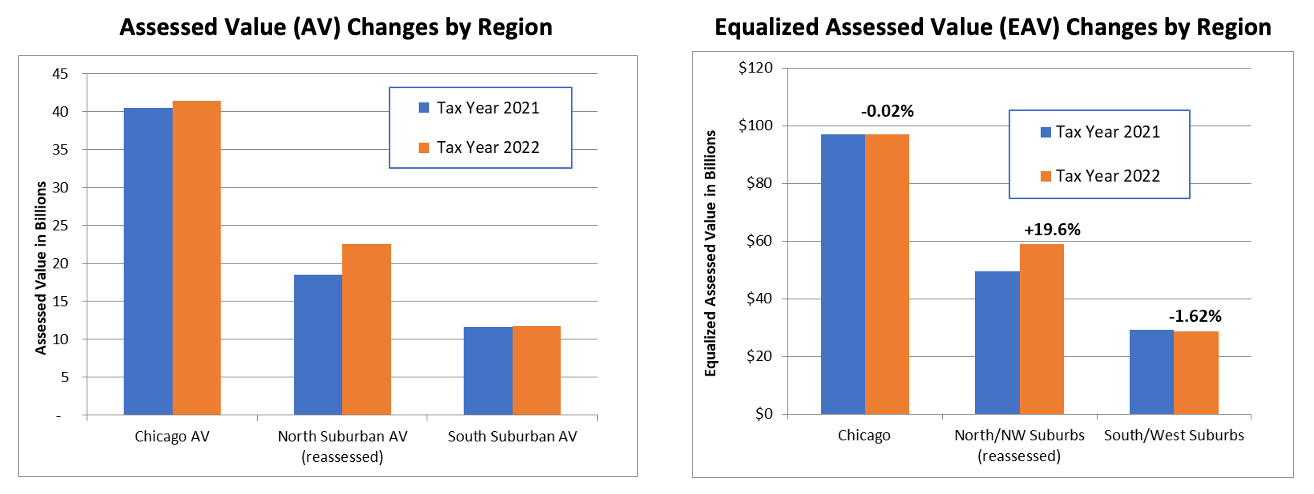
Assessment and Tax Changes by Region
The following charts show the impact of the triennial reassessment on the three regions of Cook County on overall assessed values (AVs) and equalized assessed values (EAVs) in each of the three Cook County regions). The north/northwestern suburbs, which were reassessed for tax year 2022, had a total assessment increase of nearly 22%, while assessments in the south/western suburbs remained mostly flat, and assessments in the City of Chicago increased slightly.
Comparative Property Tax Changes
Increases or reductions in assessed values do not necessarily mean increases or reductions in property taxes for individual properties. Changes in property taxes may be analyzed in many ways such as, but not limited to, by median, average, region, or municipality.
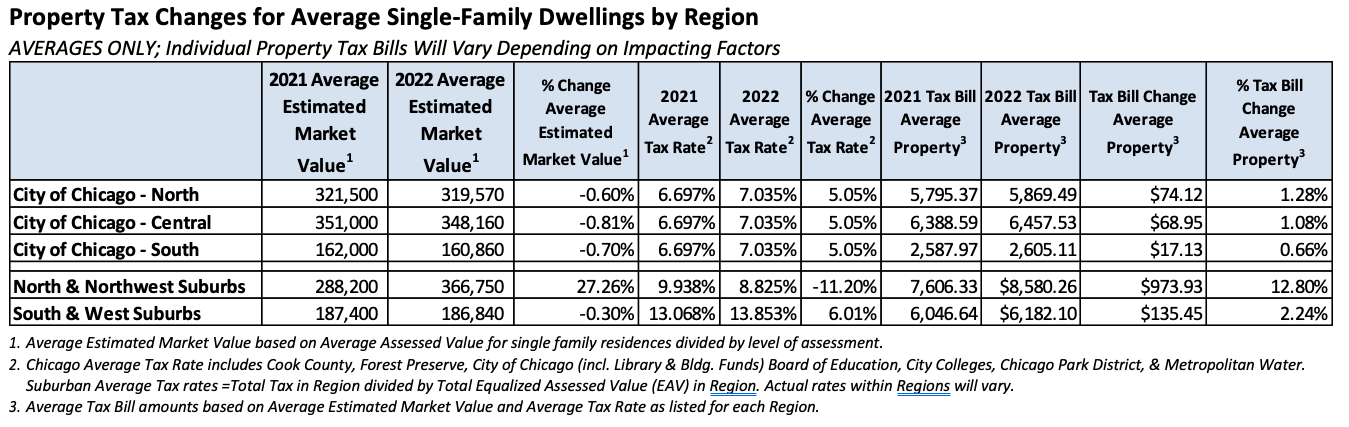
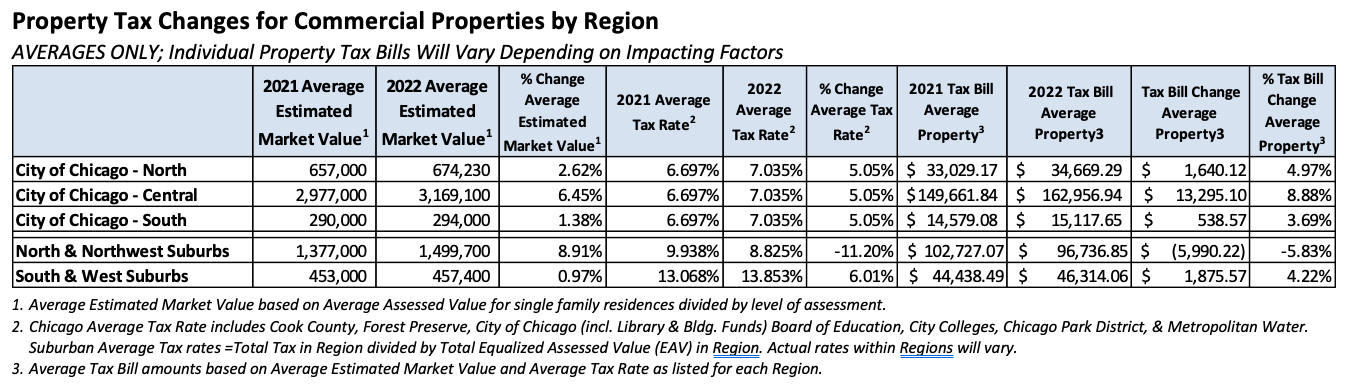
Comparing Average Residential and Commercial Properties by Region
In order to assess the changes impacting Cook County properties as a whole, the following examples utilize average estimated market values of Single-Family Dwellings and Commercial properties to evaluate possible property tax changes by region.
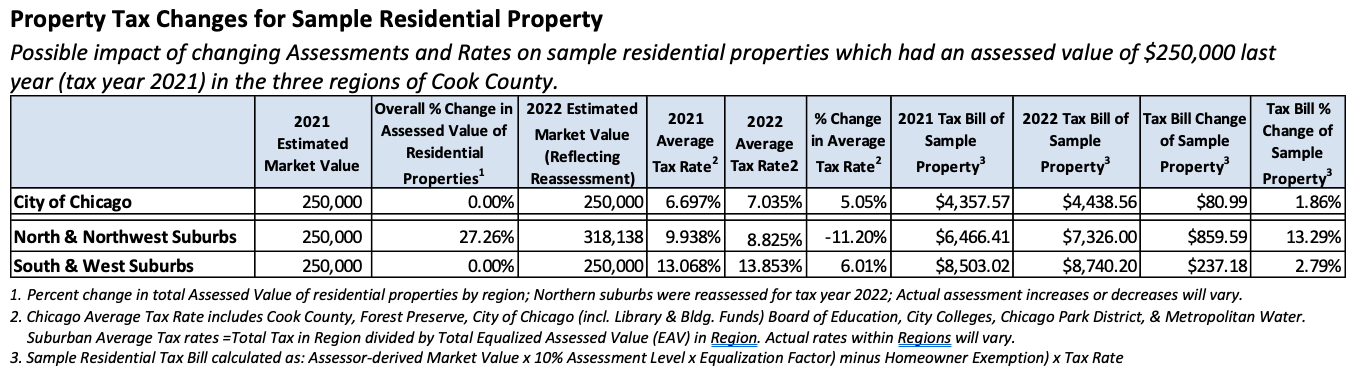
Comparing Similar-value Sample Residential and Commercial Properties by Region
The following table examines possible property tax changes for sample residential properties with the same estimated market value last year (tax year 2021) across three different regions. This reflects the impact of the 2022 reassessment in the north and northwest suburbs and overall tax rate changes across each respective region.
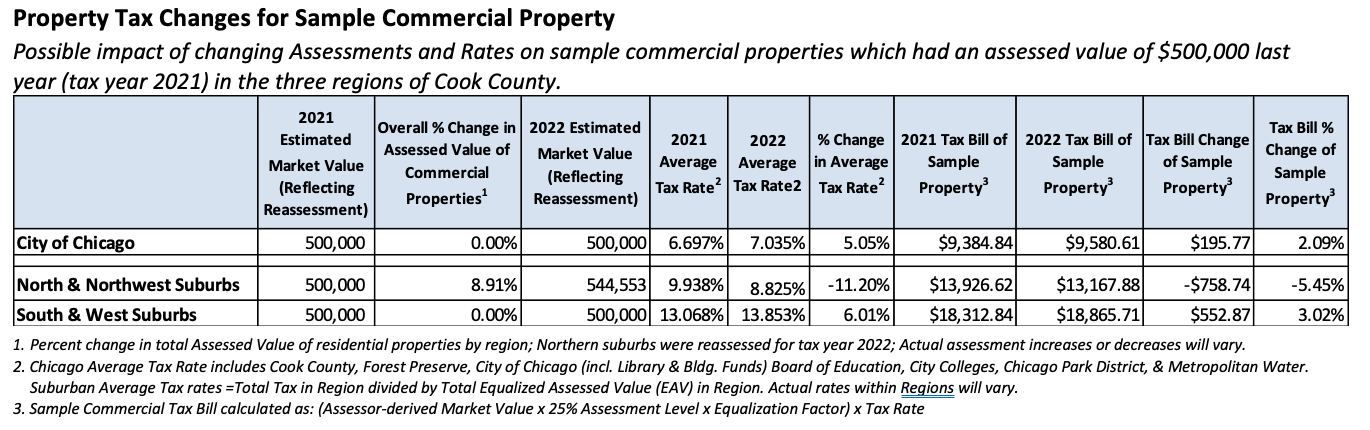
The table below examines possible property tax changes for sample commercial properties with the same estimated market value last year (tax year 2021). It illustrates the impact of the 2022 reassessment in the north and northwest and overall tax rate changes across each respective region.
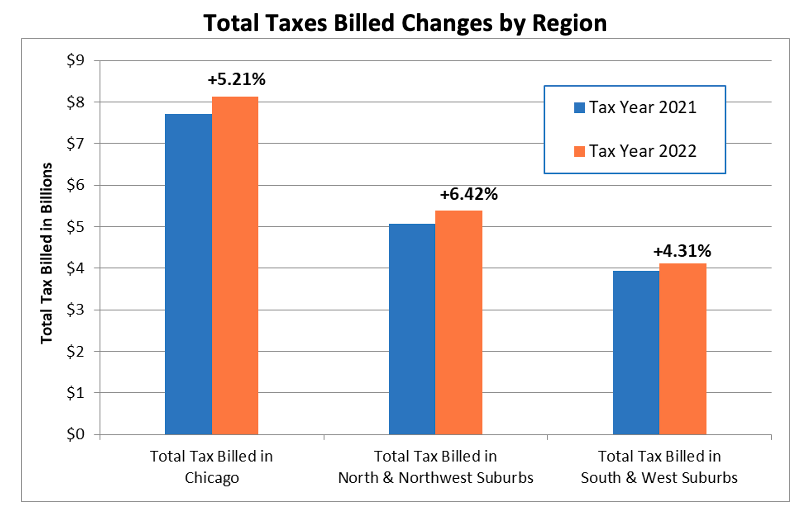
Total Tax Billed by Region
The total amount of property tax billed in Cook County increased 5.36% this year compared to last year, increasing from $16.7 billion to $17.6 billion. This increase is partly due to high rates of inflation, which are utilized in the Clerk’s tax rate calculations each year as dictated by the Illinois “Tax Cap” law. The Tax Cap Law allows most taxing districts to increase their property tax revenue each year by the Consumer Price Index for Urban Areas (CPI-U) or by 5%, whichever is lowest. For tax year 2022, the U.S. Bureau of Labor Statistics calculated CPI-U to be 7%, therefore the Tax Cap calculations used the alternate maximum increase of 5%. There are a number of exceptions to the Tax Cap Law, including Home Rule Municipalities, new construction, debt service funds, and other factors. For tax year 2023, the Tax Cap calculations will again allow for a 5% increase in property tax revenue.
The north and northwestern suburbs experienced a slightly larger increase in total tax billed compared to the City of Chicago and the south and western suburbs, primarily due to the 2022 reassessment of the suburbs north of North Avenue.
The chart below shows the increase in total tax in each of the three Cook County regions.
Factors that Impact Property Tax Increases or Decreases
The tables in the previous section provide examples of average trends within Cook County.
The four most impactful factors which affect whether or not individual property tax bills will increase or decrease are:
- The amount of property tax requested by the taxing districts (property tax levies)
- The change in the value of a property relative to other properties within the same districts (property assessment)
- The 2.6% decrease in the state-issued equalization factor compared to the prior year (from 3.0027 for 2021 to 2.9237 for 2022)
- Property tax exemptions. (For example, if a property received a Homeowner Exemption one year, but did not receive it the following year, the final taxable value of that property could be up to 10,000 higher without the exemption.)
Residential properties in the north and northwest suburbs which experienced assessment increases, may also see tax increases this year. In the City of Chicago and in the south and west suburbs, which were not reassessed this year, the average residential tax bills may remain mostly flat or increase slightly.
With over 1,400 taxing districts servicing over 1.8 million properties of numerous classifications and values, there is a great deal of variability in individual tax bills, especially suburban tax bills. Individual tax bills, especially in the suburbs where there are more taxing districts, may increase or decrease depending on the combination of taxing districts servicing those properties.
Municipalities with the Largest Increases and Decreases in Total Tax Billed
Below is a map of Cook County displaying the percentage increases or decreases in total property tax billed within each City or Village for tax year 2022. The municipalities primarily in Cook County with the largest increases and decreases in total tax are listed in the table which indicates the variation that can occur in tax bills across the County.
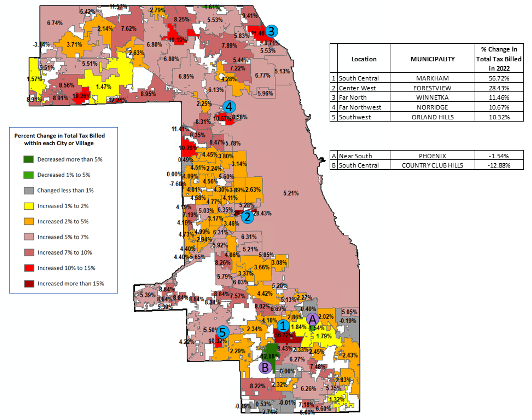
It is important to note that individual properties within each city, village, or township may experience property tax increases or decreases that do not align with the overall tax increase or decrease for that area. For example, most of the tax increase in the Village of Markham is billed to the new Amazon fulfillment center at 159th and Dixie Highway.
East Dundee, University Park, Deerfield, Deer Park and Oak Brook all overlap into the collar counties and the increases or reductions for these cities and villages only reflect a small portion of the properties in Cook County. Tax changes for properties outside Cook County are not reflected in this report.
Tax rates in the various Cook County suburbs differ due to the large number of municipalities, school districts, park districts, and other taxing districts which provide different services. Specific areas will experience larger or smaller tax changes depending on the taxing districts associated with those areas. Additionally, taxpayers within the same suburb may pay different rates based on the specific taxing districts, which provide their services.
Other factors that impact taxes:
Property Tax Relief Grants
Several years ago, the State of Illinois authorized the Property Tax Relief Program for eligible school districts. This year, 31 school districts in the south and western suburbs were able to provide property tax relief totaling $76.5 million to their constituents through this program, which provides grants in exchange for tax levy reductions.
Voter Initiatives
Each election, taxing districts have the opportunity to request voter approval for property tax increases through referenda. The most common types of property tax referendum in Cook County are debt service bonds or exceptions to the Tax Cap Law.
This chart reflects taxing districts in which Tax Cap law exceptions were authorized by voters.

Additionally, voters in the Villages of Barrington and Matteson elected to allow their jurisdictions to become “Home Rule”, which gives the villages broader governing powers and exempts them from the Tax Cap Law.
Summation
- This report has presented the general trends occurring in Cook County. Each tax bill will vary depending on specific circumstances including taxing district levies, individual assessments, and other factors.
- The total tax amount billed in Cook County has increased 5.36%, exceeding $17.6 billion for tax year 2022.
- The overall taxable value (EAV) in Cook County has increased 5.2% for tax year 2022 compared to 2021.
- While specific assessment increases or decreases within the north and northwest suburbs varied by taxing district, the overall assessment within that region increased 19.6%, primarily due to the three-year reassessment.
- The state-issued Equalization Factor decreased by 2.6% from 3.0027 in 2021 to 2.9237 in 2022. A decreased Equalization factor offsets assessment increases and amplifies assessment decreases.
- In the City of Chicago, overall taxable values remained essentially flat, as a result of small increases in assessments offset by the reduction in the Equalization Factor.
- Tax rates are generally lower in the north and north and northwest suburbs and higher in the City of Chicago and the south and western suburbs compared to last year.
- The 2022 second-installment property tax bills are currently payable online. Tax bills will be mailed by November 1 with a due date of December 1, 2023.
###